More than eighty percent of the goods that move between nations travel by sea, a figure the United Nations Conference on Trade and Development has reported consistently for years. Yet the price of moving them is among the most violent in the global economy. The Baltic Dry Index, the benchmark for bulk freight, climbed to a record 11,793 points in May 2008 and fell roughly ninety four percent, to 663 points, by December. Container rates told a similar story a decade later: the Drewry World Container Index averaged around 1,420 dollars per forty foot box in 2019, then spiked above 10,000 dollars in 2021 before subsiding. No central bank set these prices; no cartel engineered the swings. They are the output of a system no single actor controls, and understanding why it behaves this way explains a great deal about how the physical world economy works beneath the smooth surface of trade statistics.
A capital business wearing a transport costume
The decisive insight, associated with the maritime economist Martin Stopford, is that shipping is not really a transport utility but a capital cycle business that happens to move cargo. A ship is a large, long lived, single purpose asset. Once built it lasts twenty to thirty years and can do almost nothing except carry the commodity it was designed for. The owner cannot easily repurpose it, nor quickly retire it without crystallising a loss. The freight rate, then, is not a price for a service in the ordinary sense. It is the price of scarcity, the rent that accrues to whoever happens to own steel in the water when demand outruns supply.
This framing relocates the source of volatility. Demand for shipping is derived: it rises and falls with steel output, grain harvests, oil consumption and consumer spending, none of which the shipowner influences. Supply, by contrast, is almost entirely fixed in the short run. The fleet on the water this year is the fleet ordered two or three years ago. When a demand shock arrives, the only variable that can move immediately is price. Rates do not adjust gently; they detonate.
Stopford documents a recognisable anatomy to these cycles: a trough that scares owners into scrapping and idling tonnage, a recovery as demand catches a shrunken fleet, a boom that floods order books, and a collapse as those orders arrive. The conventional rule of thumb puts the interval at roughly seven years, though the real cycles are irregular, sometimes nearer a decade or more. The pattern repeats not because operators are foolish but because the structure of the asset forces it.
The lag that breaks the feedback loop
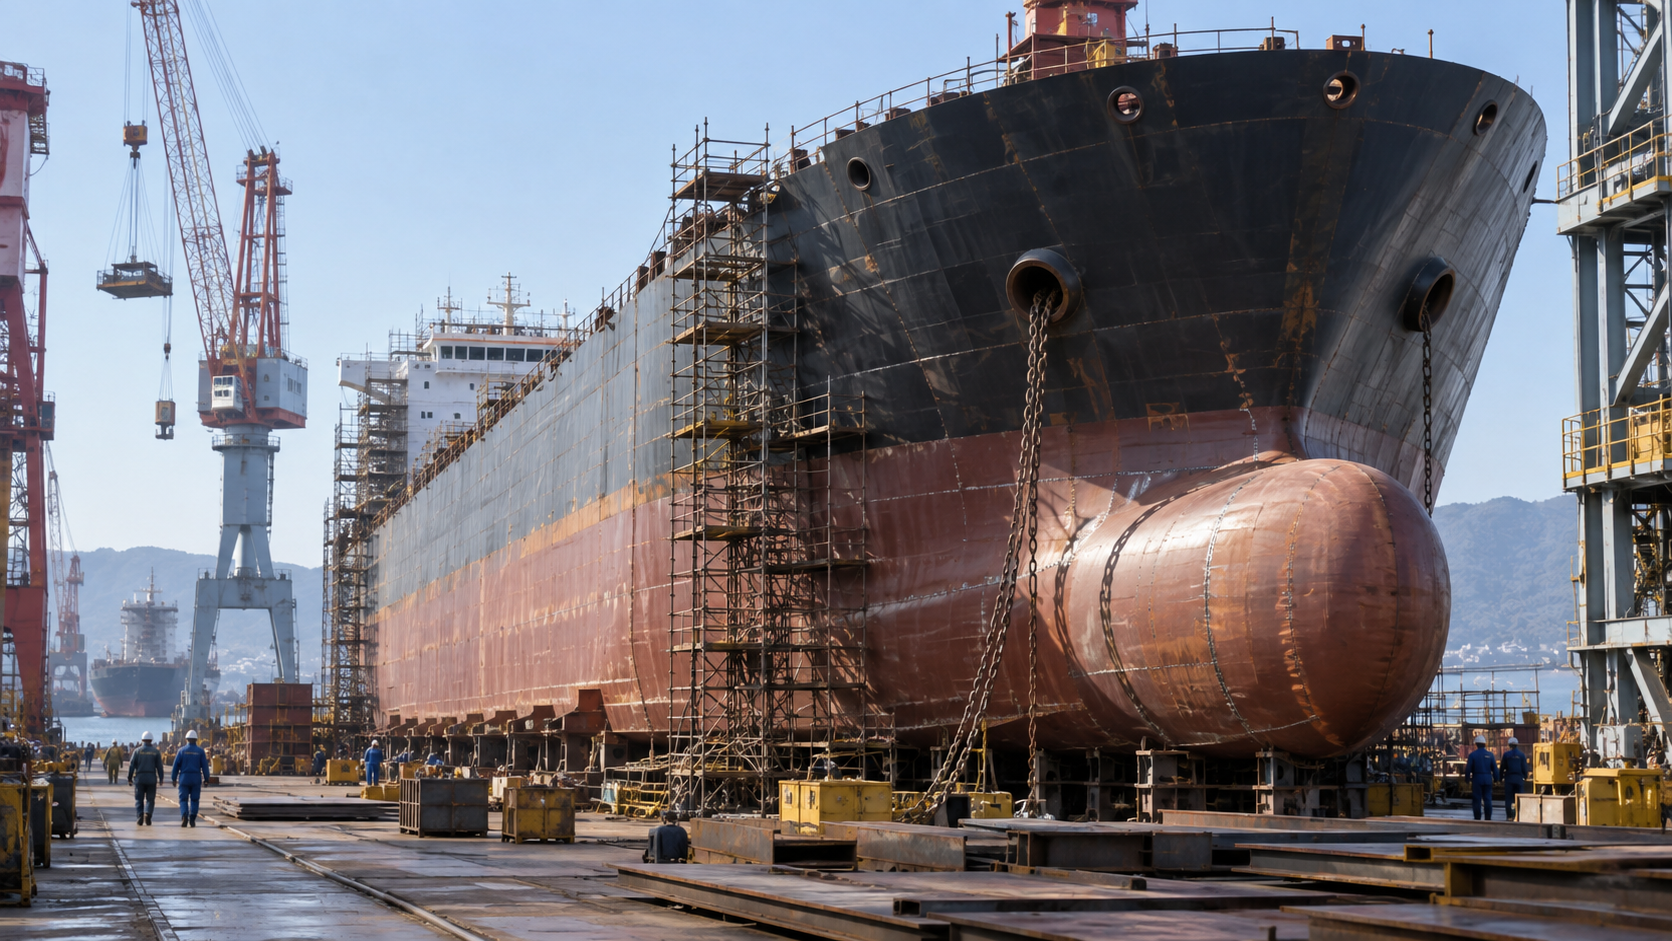
The engine of the cycle is a timing mismatch. In any well behaved market, high prices summon new supply, which restores balance. In shipping, that corrective supply arrives years late. Building and delivering a new vessel takes somewhere between eighteen and thirty six months in normal conditions, and far longer when yards are full. With the global order book concentrated in a handful of countries, China now building well over half of new tonnage by capacity and South Korea roughly a fifth to a quarter, slot availability becomes a hard constraint. In tight periods, delivery dates can stretch three to four years out, because the docks are booked.
This delay severs the feedback loop that stabilises other markets. The signal to build, a high freight rate, is observed today; the response, a new ship, lands years later, by which point the demand that justified it may have evaporated. The owner is steering by a wake. Worse, every competitor is reading the same elevated rates and reaching the same conclusion at once, so the corrective wave is not a trickle but a flood, breaking long after the storm that prompted it has passed.
The result is structural overshoot in both directions: supply is chronically too low when it is needed and too high when it is not. The market never rests at equilibrium, which is always defined by conditions that no longer exist by the time the fleet responds.
Herd ordering and the disappointment that follows
If the lag were the whole story, sophisticated owners could simply order counter cyclically, buying cheap ships in the trough and selling dear in the boom. A few legendary fortunes were built doing exactly that. Yet the industry in aggregate runs the other way, for well documented reasons. In a study of ship prices and investment published in the Quarterly Journal of Economics, Robin Greenwood and Samuel Hanson found that high current earnings predict high second hand prices and heavy investment, yet forecast low future returns. Expected one year forward excess returns in their data ranged from roughly negative forty three percent at the top of the market to positive sixteen percent at the bottom. In plain terms, the moment to buy is when everyone is selling, and the industry reliably does the opposite.
Their explanation is precise: owners over extrapolate the demand shock in front of them, treating a temporary surge as a new normal, while neglecting that every rival is ordering too. Each individual decision looks rational in isolation: rates are high, financing is available, the yard is offering a slot. In aggregate they are self defeating, because they collectively manufacture the glut that destroys the returns they were chasing. Ship prices, the authors conclude, are far too volatile to be justified by the underlying earnings, which themselves revert strongly to the mean.
This is the herd, and it is not a moral failing so much as a coordination failure. No owner can see every rival’s order book in real time, and none can afford to sit out a boom while competitors expand. The information needed to behave prudently is exactly what the market withholds.
Why rates whipsaw rather than drift
The violence of the swings follows from the geometry of supply and demand curves that are both steep. In the short run the fleet is nearly fixed, so the supply curve is close to vertical until laid up ships return. Demand is inelastic: a steel mill that needs iron ore needs it now, almost regardless of the freight cost, because freight is a small fraction of the delivered commodity value. When two inelastic curves intersect, small shifts in either produce enormous moves in price. A change of a few percent in cargo volume against a fixed fleet can double or halve the spot rate.
This is why the Baltic Dry Index can lose most of its value in months, and why a container route can run from fifteen hundred dollars to over ten thousand and back inside two years. These are not anomalies; they are the normal output of rigid supply meeting variable, urgent demand. The volatility is the feature, not the bug.
The scrapyard as the only release valve
Because supply cannot be added quickly, the only way it contracts is through demolition, and the breaking beaches of Alang in India, Gadani in Pakistan and Chattogram in Bangladesh are where the cycle finally clears. When rates fall toward the combined cost of fuel, crew and operation, marginal ships are sold for scrap steel and the fleet shrinks until the next recovery. Scrapping is the industry’s slow, brutal release valve.
But it operates with its own lag and perversity. Owners scrap most aggressively at the bottom, when sentiment is darkest, which sets up the next shortage; they scrap least when rates are high, retaining old tonnage that should have gone, which deepens the eventual glut. The mechanism that corrects oversupply is itself mistimed, reinforcing rather than damping the swing.
Why no one can switch it off
The natural question is why the cycle cannot be managed away. The answer is that the industry is structurally fragmented and globally distributed, which makes coordination impossible. Ownership spans thousands of operators across dozens of flag states, financed by banks, private equity and shipyards from Athens to Singapore, and governed by no single regulator. Liner alliances coordinate schedules in the container trades, but they cannot control the order book, and antitrust regimes constrain how far they may try. Bulk shipping, the freest market of all, has no coordinating mechanism whatsoever.
Each rational actor responds to prices that are themselves the aggregate of every other actor’s responses, with a multi year delay baked in. That is a recipe for oscillation, not stability, and it self perpetuates, because the corrective behaviour, building in booms and scrapping in busts, is the very thing that generates the next swing. The cycle is not a market failure to be fixed; it is the equilibrium behaviour of the system as it is built.
The strategic implication runs well beyond shipping. The freight cycle is a clean, observable instance of a pattern that recurs wherever supply is lumpy, long lived and slow to build while demand is volatile: semiconductors, oil refining, commercial property, data centres. In each, the lag between the decision to invest and the arrival of capacity guarantees overshoot, and the herd guarantees the overshoot is shared. Shipping is simply the purest specimen, because the asset is so visible and the cycle so old. Those who understand it learn to read the order book rather than the spot rate, to buy when steel is being beached and sell when yards are full, and to treat the consensus of the moment as the most reliable contrary indicator on offer. The boom and bust is not a flaw in global trade. It is the price the world pays for moving almost everything across water, on assets that take years to build and decades to retire, owned by no one who sees the whole board.
Read our full Report Disclaimer.
Report Disclaimer
This report is provided for informational purposes only and does not constitute financial, legal, or investment advice. The views expressed are those of Bretalon Ltd and are based on information believed to be reliable at the time of publication. Past performance is not indicative of future results. Recipients should conduct their own due diligence before making any decisions based on this material. For full terms, see our Report Disclaimer.